
For the first time in quite a while, CEDIA released the results of a new market study that helped to illuminate where the market is at today. There were, as usual, some significant surprises presented – perhaps the first was an interesting change in methodology that may perhaps serve to deliver a clearer view of key market data.
See what I found in this latest CEDIA market study…
In a special presentation to the industry media, Giles Sutton (CEDIA) and Krista Roseberry (Ancrage Consulting), revealed the results of the latest market study from the association, called the Integrated Home Market Analysis – 2021 (previously known as the Size and Scope survey). While overall a reasonably optimistic report from survey respondents, there were some surprises here.
This new CEDIA market study was produced with the help of market research firm Ancrage Consulting LLC, in conjunction with the Butler University Lacy School of Business.
Even before the results were presented, we learned from Ancrage’s Krista Roseberry, that the market research firm took a significant departure from the way this data was compiled in the past. She told the assembled journalists, “Of course, all of us know that global disruption over the last two years led to a variety of challenges as well as some unique growth opportunities in this space,” Roseberry said. “With that in mind, we started this project by understanding the most important research needs of manufacturers, dealers and distributors. We updated the design of the research to then focus squarely on those goals.”
How did they learn what those “research needs of manufacturers, dealers and distributors” were? Simple, they asked them. Ancrage reached out to 19 key leaders of top companies in the custom integration space to both learn their needs for such research and to discover what their data showed about the market. From this information, they then focused this research on those topics.
A Methodology Change that Makes a Difference
Some key decisions were made early on that likely had a significant influence on both the design of, and results from, this research. What were some of those decisions?
- They reduced the time needed to take the survey from about one hour to just fifteen minutes
- Starting in the summer of 2021, they began by interviewing manufacturers and distributors in the U.S. and the U.K.
- Especially in the U.S., they spoke to 19 leading manufacturers and distributors, “often in very senior leadership positions for those companies,” Roseberry said.
- From these discussions, they “…learned about their view of this industry – its size and their estimated market share and trends that they were seeing develop.”
- Based on what they learned, the survey was redesigned and launched online between September and December of 2021
- The survey was designed to capture only the key decision-makers from the responding integration companies
- Only one survey per company was allowed
It’s important to note that this step of interviewing 19 key industry players was a new procedure that distinguishes the results of this survey from those generated in past CEDIA “Size and Scope” studies. But a key benefit of comparing notes with key distributors and manufacturers is that it gave CEDIA much greater confidence in their market sizing estimates.
Participants Included CEDIA and Non-CEDIA Integrators
Another benefit of taking this approach is that non-CEDIA members participated in the survey. Overall, about 25% of the participants were non-CEDIA members, while the majority 75% were members. Still, this opened the door to input from those outside the CEDIA universe. I’d say that’s a good thing.
The new approaches taken this year represent a tightening up of the mechanics or methodology of the survey in an effort to improve the quality of the data. As a result of these restrictions, the data we saw reflected a total sample size of just 80 integration companies. Roseberry admitted that with fewer restrictions, they could have had “hundreds” more participants, but felt these would only serve to have “…cluttered the dataset and loosened the focus on strategic topics.”
A Small Sample Size, But Highly Vetted Participants to Ensure Quality
I take her point, but that is an awfully small sample size. Data scientists will tell you that as a general rule the smaller the dataset, the lesser the accuracy. This 2021 study (the study is dated 2022, but the data is from 2021) goes on to estimate the total market size as 11,000 integrators. This means that we are drawing conclusions on the overall market with a sample that represents less than 1% of the total market.
However, CEDIA’s researchers counter this with the fact that they highly vetted participants to ensure that the right people – company leaders for example – were the only ones responding.
Before I move on to their results, let’s make sure you understand the time frame of the data. The report’s findings for “last year” cover the period of time defined as fall 2020 to fall 2021. And the report’s forecast for “this year” is meant to be represented by the period of winter 2021 through winter 2022.
I will also compare select pieces of this data to the most recent data I have available to me – the Size and Scope Survey from 2018 (covering the year of 2017). There are some interesting comparisons there. So let’s get started!
Market Size
CEDIA says that there are a total of about 11,000 integration companies in the U.S. The average company does approximately $2.2 million in annual revenue. The average project size of $26,000. According to the survey, about 83% of the “typical” integrator’s revenue is from residential projects.
Taking all that together, you get a total market size of $20.1 billion. The forecast for the total market for 2022 is $22.7 billion. This is based on forecasts from the survey participants – which, if past is prologue, is likely an overestimate. Integrators, it seems, are a very optimistic bunch and they expect strong double-digit growth of 13% this year.
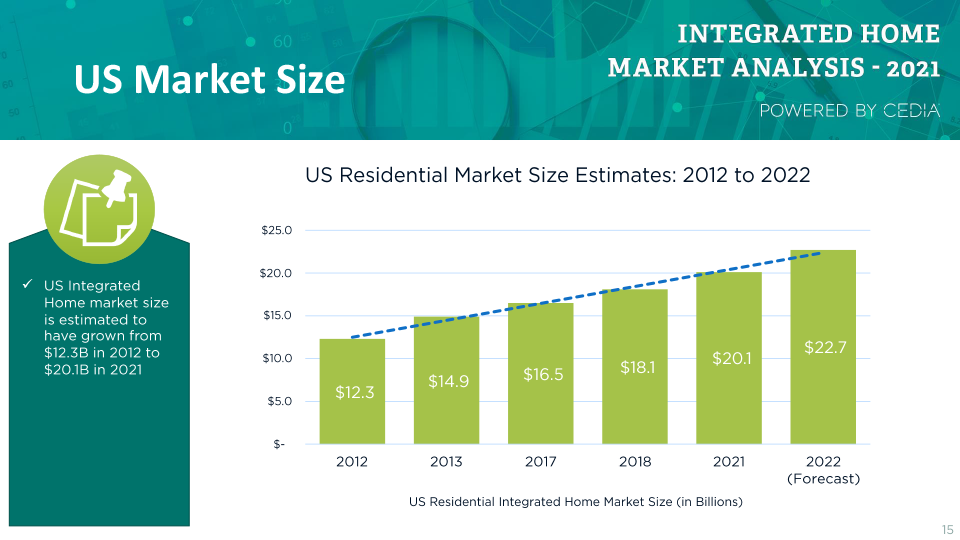
It’s interesting to note that when compared to the data CEDIA shared back in the pre-pandemic year of 2018, the numbers are not so much different. As you can see in the chart below, the previous research company looked at revenue projections based on an overall median calculation, then an average calculation. When averaging those numbers together, they estimated the overall market to be $19.74 billion – just 1¾% below the estimate for 2021.
Integrator Company Details
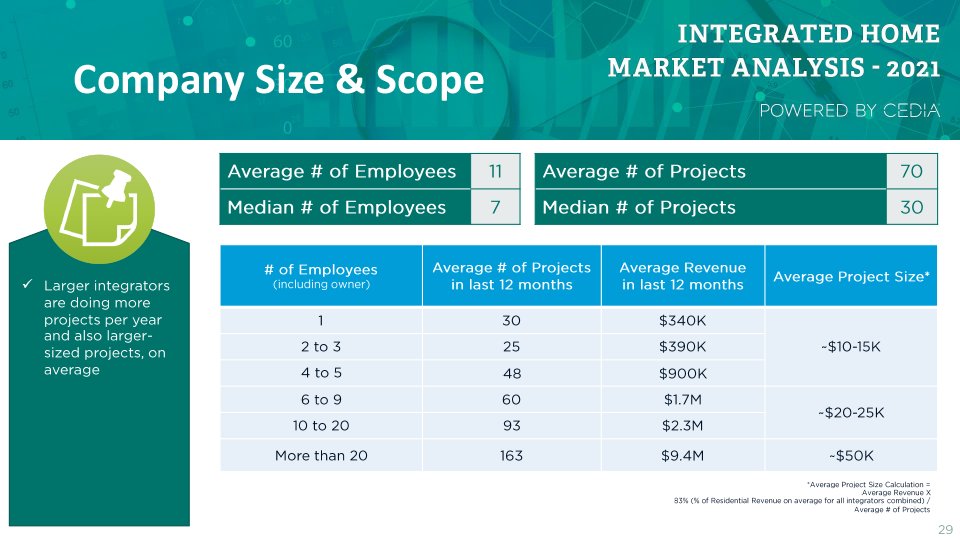
According to Roseberry, the average integration company has 11 employees and does about 70 projects a year. However, I think looking at averages is a little misleading, as they can be skewed by the larger reporting companies. I tend to look at the median numbers, the point halfway between the largest and smallest number. Looking at the typical integrator in this way shows that they have a median of 7 employees and do about 30 projects a year.
Smaller companies tend to have an average project size of around $10,000-$15,000. Medium-sized integrators have an average project size of $20,000-$25,000. While the larger integrator’s average project size is $50,000. So not only do the larger integrators do more projects, they do larger projects, Roseberry noted in the presentation.
Select Trending Information
There were some surprising trends revealed during the presentation. For example, the average integrator annual revenue has remained fairly consistent at around $2 million for years. In fact, if anything, it has declined slightly as compared to 2018.
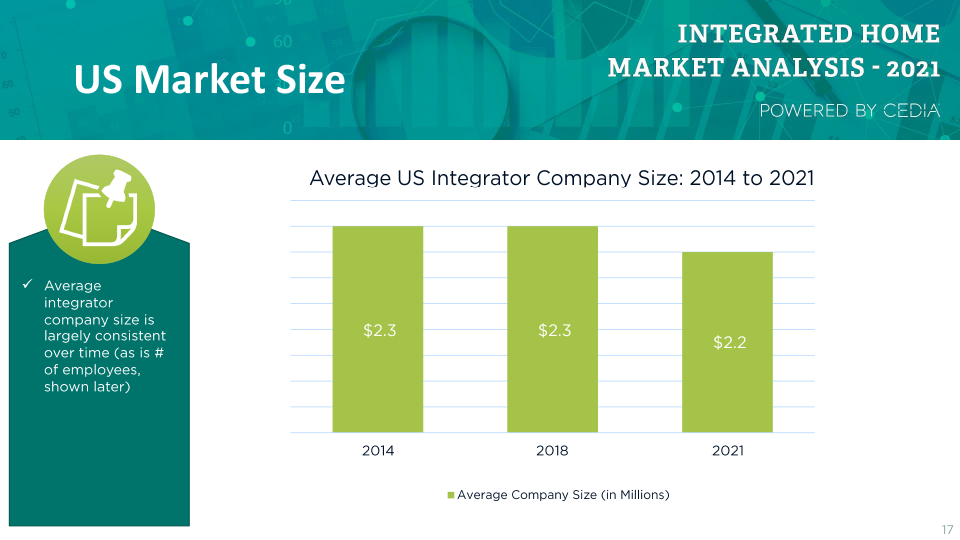
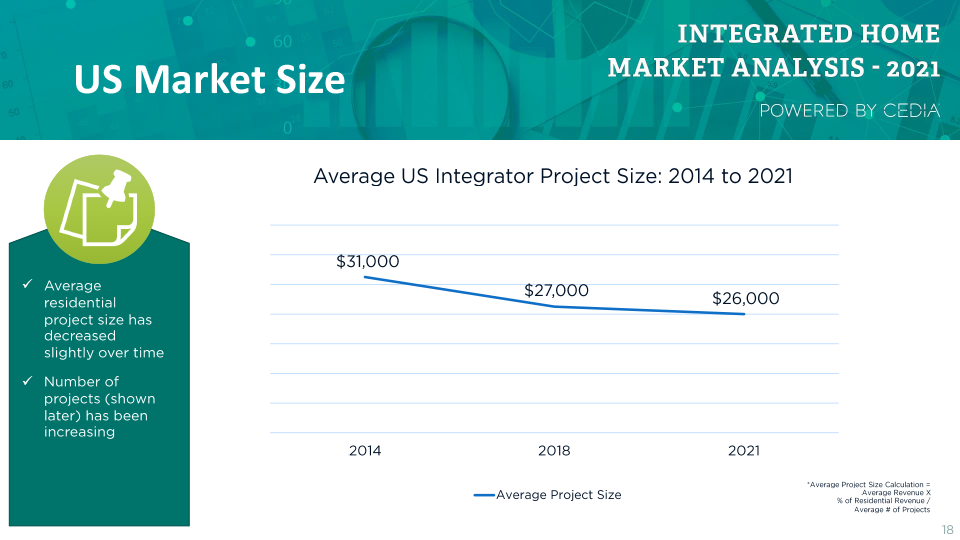
The same thing can be said for the average project size. In looking at the trend chart below, we find that the average project size is smaller in 2021 than it was in 2014 – from $31,000 in 2014 to $26,000 in 2021. This surprised me considering all of the systems and upgrades that were being installed in 2020 and 2021 as a result of COVID-forced home quarantining.
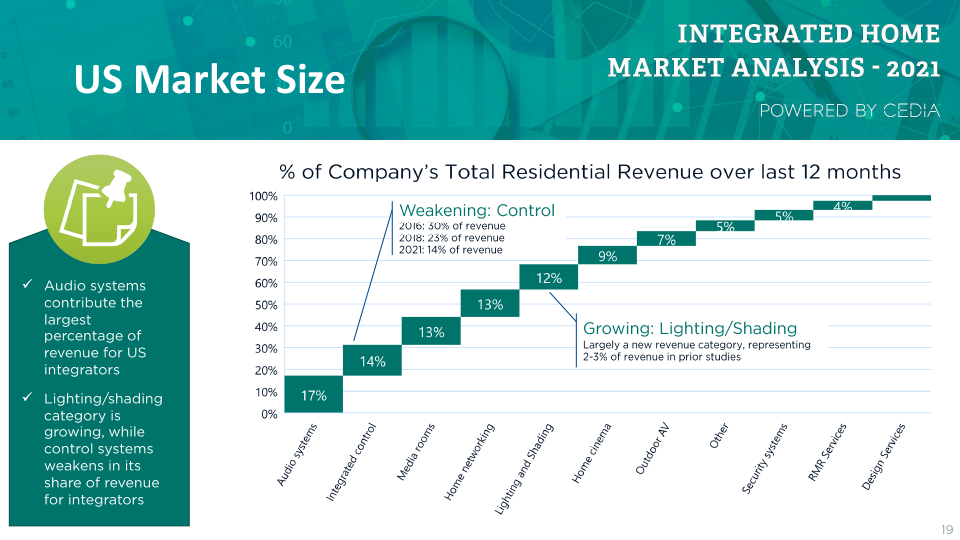
There are many trends covered in this market study. On the slide below, which is not a trend chart, CEDIA showed the percentage of sales by product category for the typical integrator. And on this slide, they added some interesting trending information. According to survey respondents, control systems have declined as a percentage of their systems sales rather dramatically – from 30% in 2016 to 14% last year. Off by more than half on average. On the other hand, lighting and shading have exploded, from just 2% in previous years to 12% now.
Wrapping it Up – Key Trends
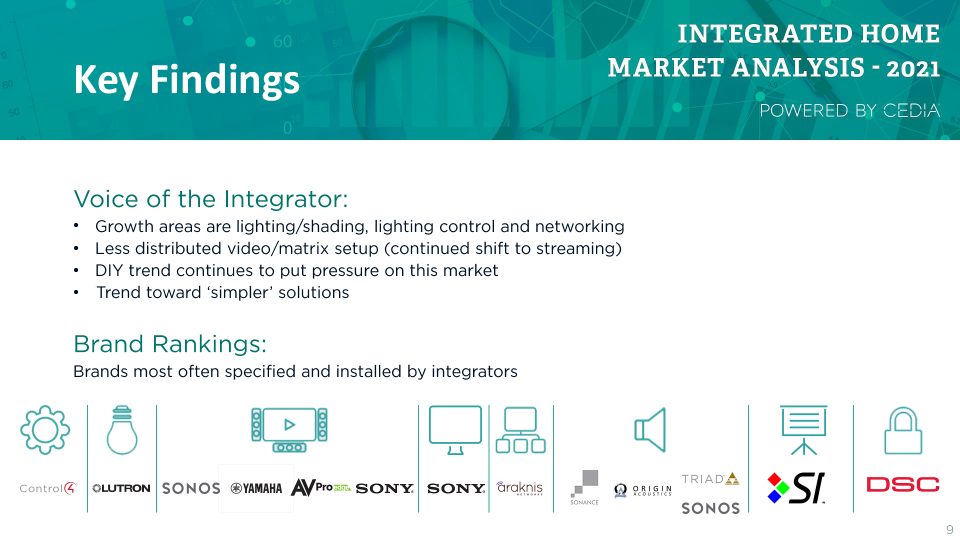
I could go on, there is a ton of great information in this new CEDIA market study – including many more charts that drill down on the areas mentioned above, and more. In the slide below you can see a summary of the key findings of the survey. There at-a-glance are the hot trends (lighting/shades, lighting control, networking), the declining trends (distributed video/matrix, due to popularity of streaming), top integrator issues (DIY), and my favorite…the trend for simpler solutions.
If you are a CEDIA member, the 2021 CEDIA Integrated Home Market Analysis is available to you at no charge in the Research Library on the CEDIA website in the members’ section. I recommend you get yourself a copy and study it carefully so you can benchmark your business against industry averages.
Learn more about CEDIA by visiting: cedia.net.


Leave a Reply